Task 1
Create a visualization that provides a breakdown between the male and female employees working in the company each year, starting from 1990.
The SQL output will display 3 columns: Calendar_year, gender, num_of employees
SELECT
YEAR(d.from_date) AS calendar_year,
e.gender,
COUNT(e.emp_no) AS num_of_employees
FROM
t_employees e
JOIN
t_dept_emp d ON d.emp_no = e.emp_no
GROUP BY calendar_year , e.gender
HAVING calendar_year >= 1990;
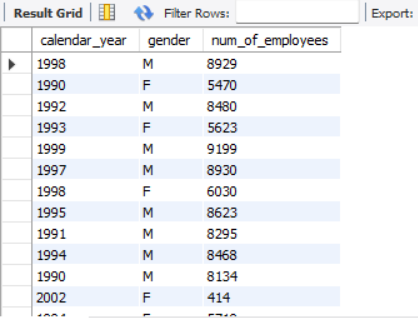
OUTPUT:
I saved it and opened it in Tableau and chose a Bar Chart
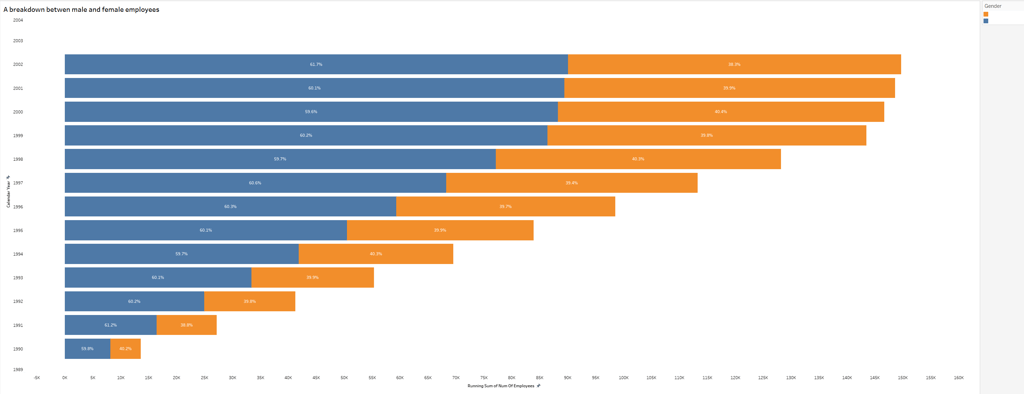
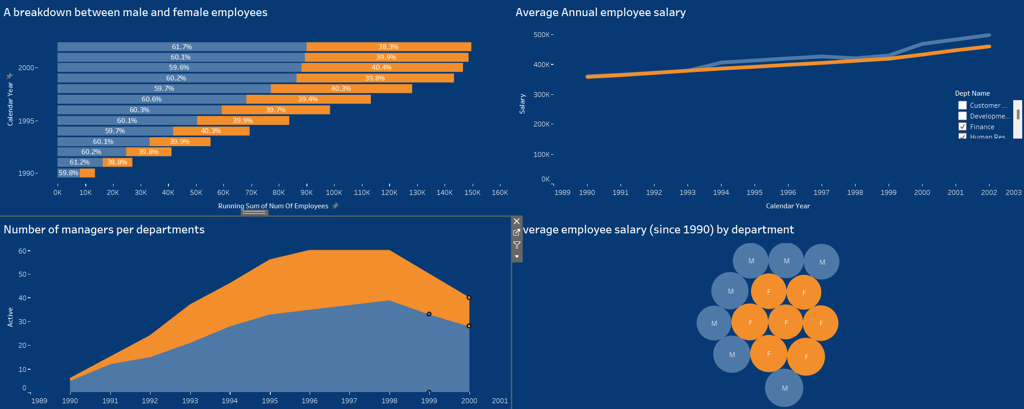
This visualization allows us to see that in 1990 there was less than 15,000 workers, while in 2022 just 12 years later, there were close to 150,000 workers. Additionally, the increasing number of employed workers throughout the years has ben constant and the ratio between male and female employees in the company has always been 60 to 40%
TASK 2
Compare the number of male managers to the number of female managers from different departments for each year. stating from 1990.
The SQL Output will display 6 columns plus another column that will describe whether the manager is active or not.
MySQL query :
I first started by selecting the fields. All these columns need to be preceded by their appropriate aliases:
Then, I created the "active column" by using the CASE statement:
CASE
WHEN YEAR(dm.to_date) >= e.calendar_year AND YEAR(dm.from_date) <= e.calendar_year THEN 1
ELSE 0
END AS active
Now, I used the JOIN statement to unite the columns from different tables through their relevant matching fields.
FROM
(SELECT
YEAR(hire_date) AS calendar_year
FROM
t_employees
GROUP BY calendar_year) e
CROSS JOIN
t_dept_manager dm
JOIN
t_departments d ON dm.dept_no = d.dept_no
JOIN
t_employees ee ON dm.emp_no = ee.emp_no
ORDER BY dm.emp_no, calendar_year;
OUTPUT:
I saved it and opened it in Tableau and chose an Area Chart


Hovering over certain parts of the Area Chart allows us to obtain specific quantitative information. For example, in 1996 there were 64 male managers working in the company. While 44 female managers were employed during the same calendar year. To reply to the initial task, I added the department name to the field section; this way I can filter the chart by Dept Name. (See Value list on the top right of the Chart)
TASK 3
Compare the average salary of female versus male employees in the entire company until year 2002, and add a filter allowing you to see that per each department.
The SQL Output will display 4 columns: Gender, dept_name, salary, calendar_year
MySQL Query
First I selected the columns with their appropriate aliases. For Salary, I used the ROUND function with the first argument equal to the average salary value and a second argument equal to 2. The result lets me round the salary value to 2 decimals.
SELECT
e.gender, d.dept_name, ROUND(AVG(s.salary), 2) AS salary, year(s.from_date) as calendar_year
Then I used the JOIN statement to unite the columns from different tables through their relevant matching fields (emp_no) starting with the FROM statement.
FROM
t_employees e
JOIN
t_salaries s on e.emp_no = s.emp_no
JOIN
t_dept_emp de on de.emp_no = s.emp_no
JOIN
t_departments d on d.dept_no = de.dept_no
Since the task requires me to separate the data by department, gender and year. Then, I used the GROUP BY statement to group the three fields.
GROUP BY
d.dept_name, e.gender, calendar_year
This is followed by the HAVING statement, restricting the calendar year to be no higher than 2002. Finishing with the ORDER BY statement
HAVING calendar_year <=2002
ORDER by d.dept_name;
I saved the output and opened it in Tableau and chose a Line Chart
OUTPUT:
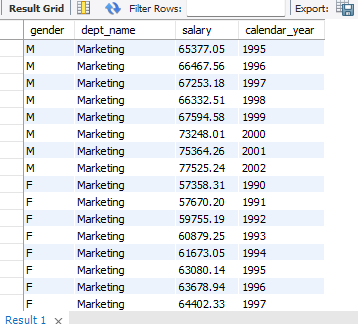
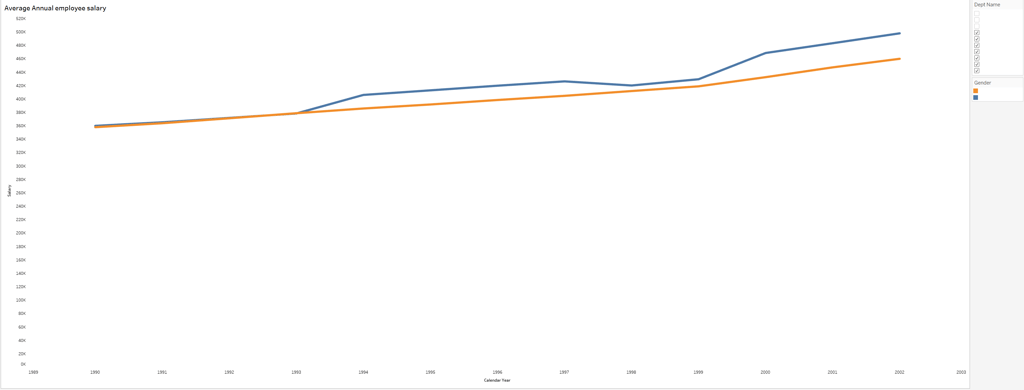
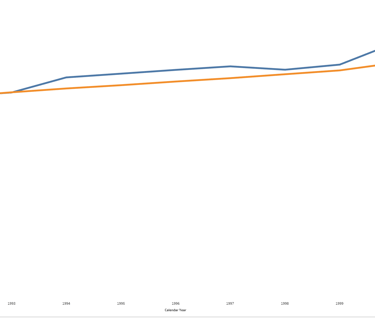
For this task, I used the Line Chart, it doesn't just illustrate the averages salaries paid for a certain year, but will also give a good indication of the trend throughout the entire period from 1990 to 2002, Once again, I filtered the chart by department names, which helps answer the task in comparing the salaries between male and female employees in the entire company. By clicking "All" in the Dept_name" in the upper right, we'll get the comparison for the entire company. If we want to be more specific, we can click in any department names. For example, in the Marketing department in 1996 the average salary of the male employees was $66,468. According to our SQL Output that is 100% true. For female employees in that same year, the salary was $63,679. According to the SQL Output that is also true.
TASK 4
Create an SQL stored procedure that will allow you to obtain the average male and female salary per department within a certain salary range. Let range be defined by two values the user can insert when calling the procedure.
The SQL Output will display 3 columns: Gender, dept_name, avg_salary
The first two commands are SQL statements used to retrieve the minimum and maximum salary values from the "t_salaries" table respectively.
SELECT min(salary) from t_salaries;
SELECT max(salary) from t_salaries;
Next, I created a new stored procedure named filter_salary. The first two commands are SQL statements used to retrieve the minimum and maximum salary values from the "t_salaries" table respectively. I used the "IN" keyword, which specifies that the parameters can be used to pass values into the procedure. As well as "FLOAT", which means they can store decimal values.
DELIMITER $$
CREATE PROCEDURE filter_salary (IN p_min_salary FLOAT, IN p_max_salary FLOAT)
As specified, I'll need three columns from different tables.
BEGIN
SELECT
e.gender, d.dept_name, AVG(s.salary) as avg_salary
Next, we JOIN the three tables with the t_departments table.
FROM
t_salary s
JOIN
t_employees e ON s.emp_no = e.emp_no
JOIN
t_dept_emp de ON de.emp_no = e.emp_no
JOIN
t_departments d ON d.dept_no = de.dept_no
Then, I used the WHERE statement to indicate the two parameters that should be taken into consideration. Followed by the GROUP BY to complete the BEGIN and END block.
WHERE s.salary BETWEEN p_min_salary ANd p_max_salary
GROUP BY
d.dept_no, e.gender;
END$$
Finally, I set the delimiter back to semicolon and run the code. Now the procedure can be called. For instance, I used 50,000 and 90,000.
DELIMITER ;
CALL filter_salary(50000, 90000);
OUTPUT:
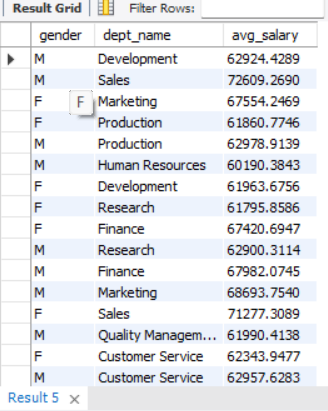
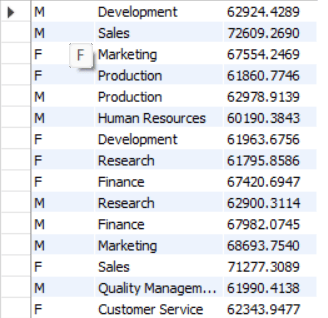
I saved the Output and opened it in Tableau.
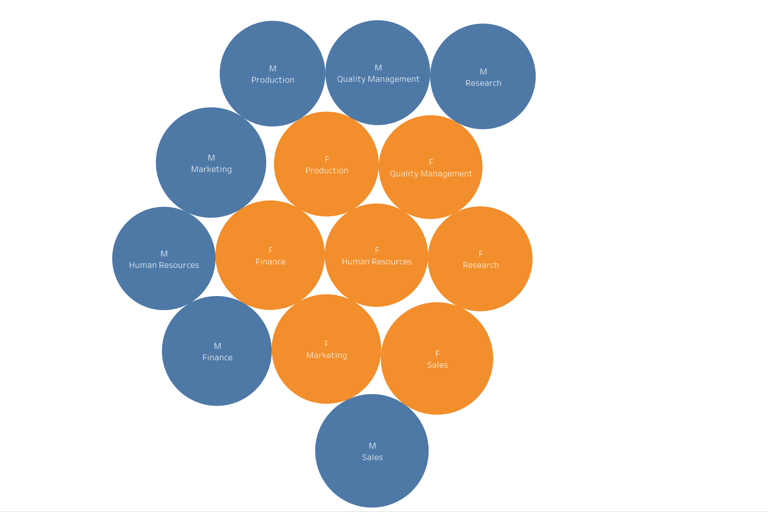
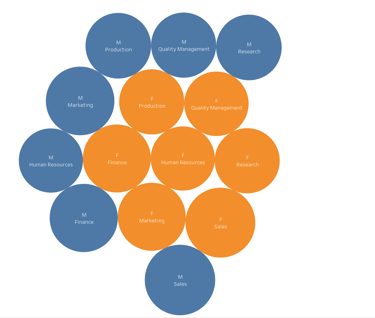
In this visual I can focus on the average annual female salary by department by simply hovering over the orange circles. Naturally, you can repeat this with male employees or the blue circles.
Finally, I organized all the charts into one dashboard. To experience an interactive dashboard, click on the image below.

Data organization in MySQL + Tableau
This project aims to complete 4 tasks by answering questions around the dataset. The dataset has been manipulated in SQL and later visualized in Tableau. For this project, I used the Employees_mod dataset.