
Card Expense Manager
First, Let's see how to use the card strategically for expenses that earn the most membership rewards points.
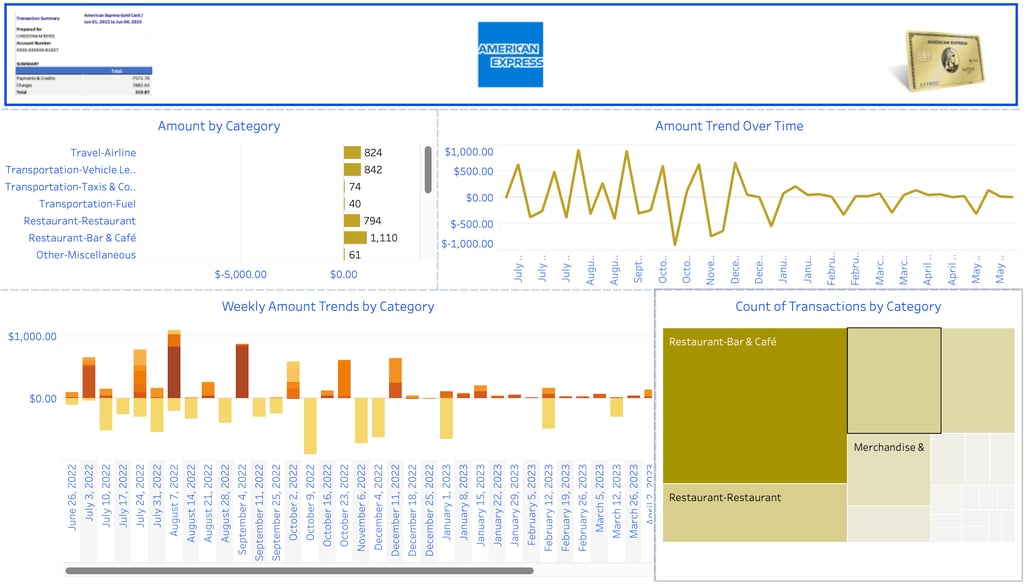
I started by meticulously extracting my annual credit card statement data into an Excel spreadsheet, paving the way for a comprehensive financial analysis. Then using Tableau, I dissected and visualized my expenditure patterns.
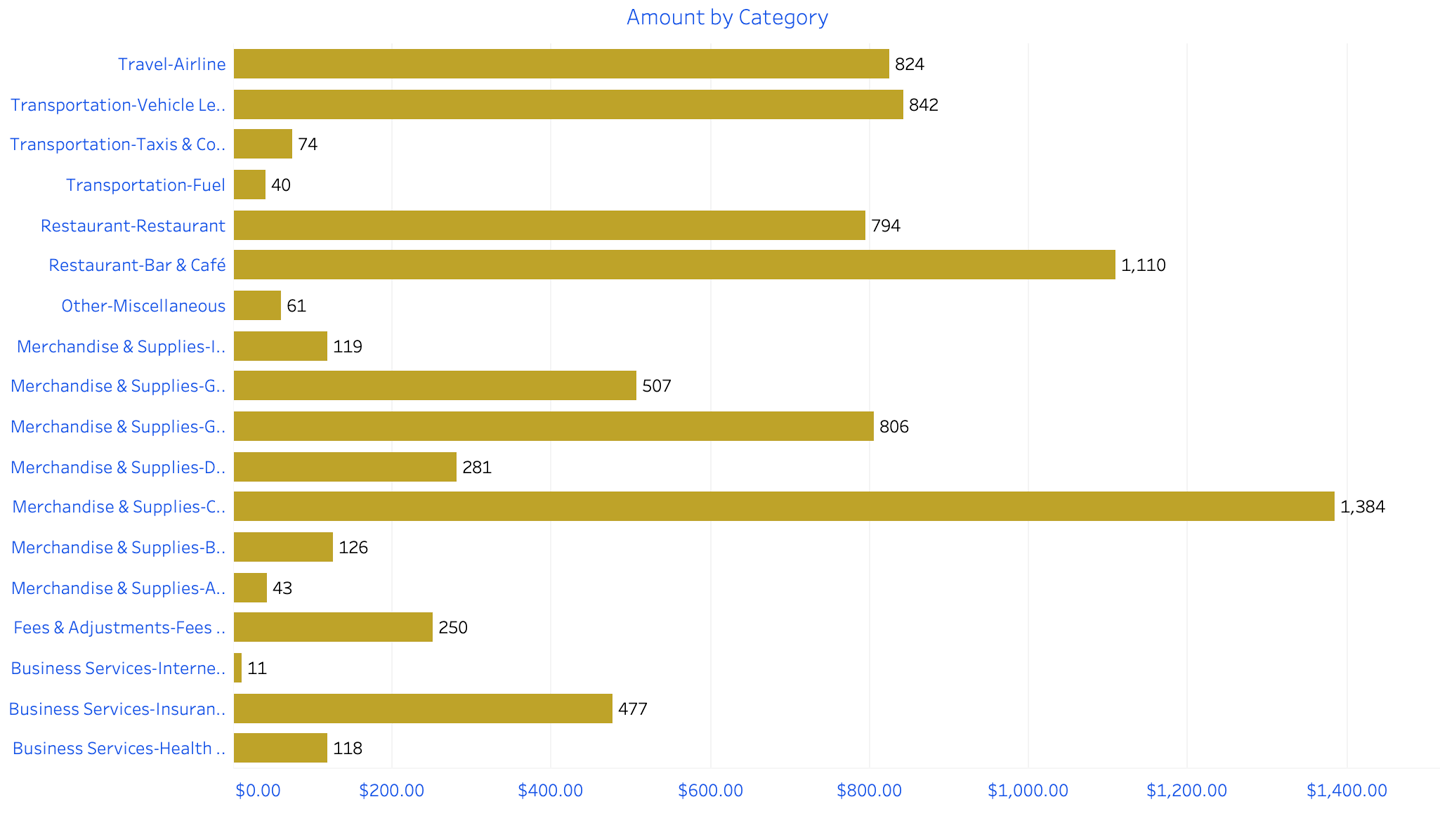
In the first chart, we can observe two significant expenses from the previous year. The first expense is in the category of Merchandise & Supplies Clothing Stores, amounting to $1384.00. This is followed by the expense in the category of Restaurant Bar & Cafe, totaling $1110.00. It is interesting to note that although the Restaurant Bar & Cafe category has a higher count of transactions, it falls behind in terms of total expenditure. If the goal with this specific card is to maximize rewards points, it would make more sense to spend more on restaurants and cafes. After all, this card is designed as a foodie card, offering 4 points for every dollar spent in that category.
The rewards point system operates as follows:
4x points for Membership Rewards® Points at restaurants worldwide
4x Membership Rewards® Points at U.S. supermarkets
3x Membership Rewards® Points for flights booked directly with airlines or on amextravel.com
1x Membership Rewards® Points on other purchase
Next, let's identify the occasion when the highest expenditure was made and explore the potential reasons behind it.
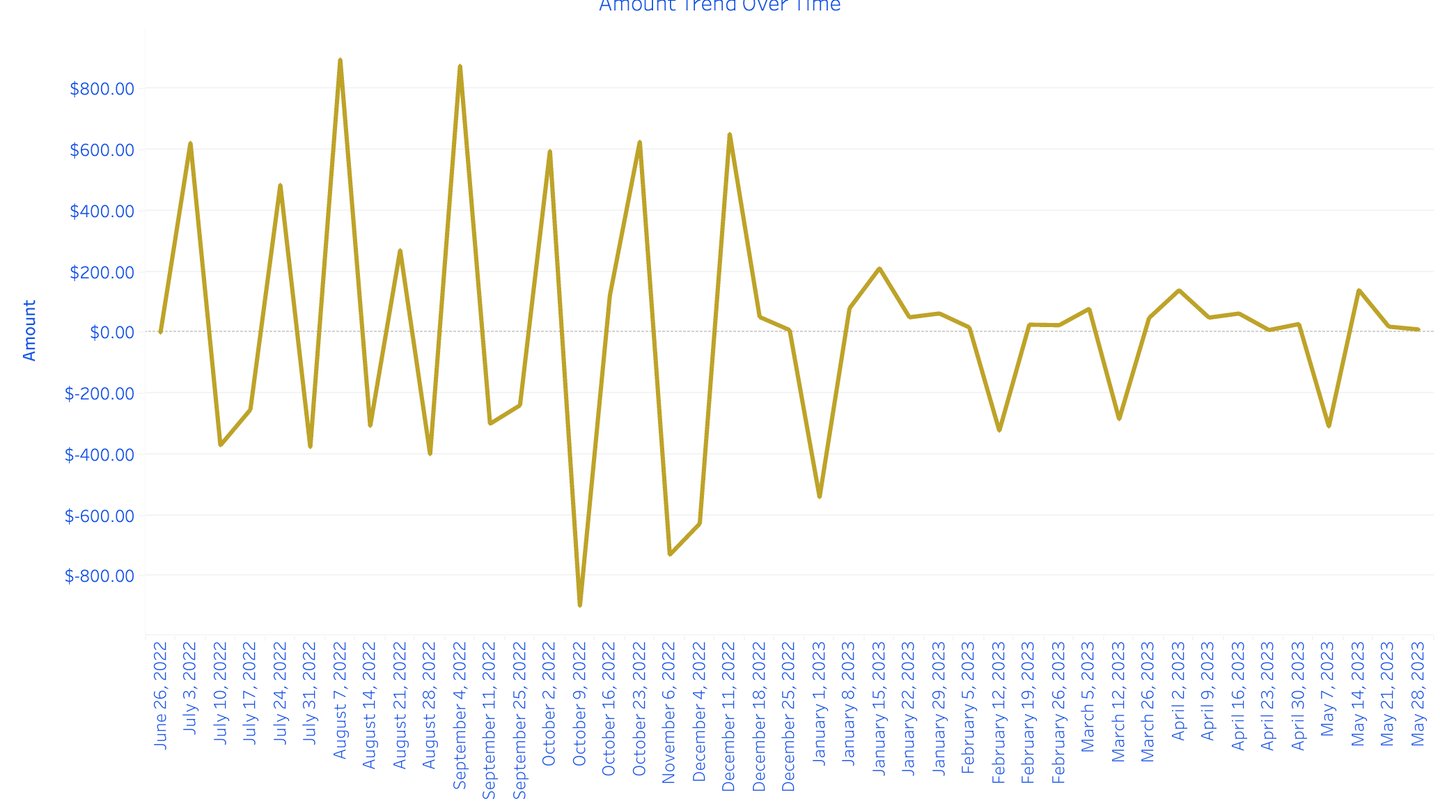
As depicted in the chart above, the majority of the highest expenditure occurred within the first four months of opening the card in June 2022. This can be attributed to the card's introductory offer, which required a minimum spend of $4,000 within the initial four months to unlock a reward of 90,000 points. The data illustrates that between June 26th and October 23rd of 2022, I successfully met this requirement by spending a total of $4,500.57.
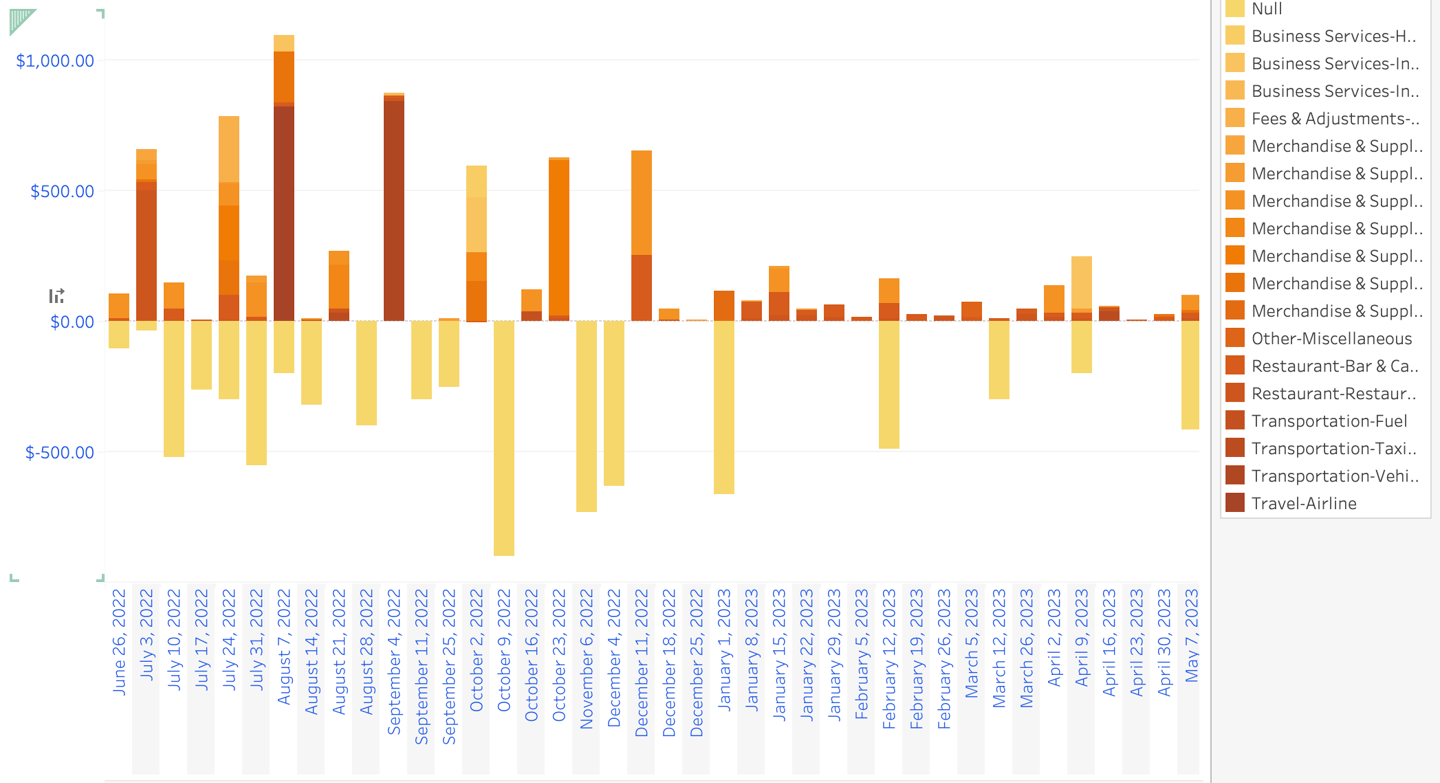
Next, Let's break down and analyze my expenses by category on a weekly basis.
As again evidenced in the chart above, a significant portion of the weekly expenditure during the first four months after opening the card in June 2022 was channeled into two categories: Restaurant-Restaurants and Restaurant Bars & Cafes. When we look at the data from a monetary perspective, four categories draw attention due to their higher amounts:
Merchandise & Supplies - Clothing Stores: $600.44
Restaurant-Restaurant and Restaurant Bar & Cafe: $784.59
Travel - Airlines: $824.18
Transportation - Vehicle Leasing and Purchase: $842.24
This suggests that these were the primary areas of expenditure during this time frame.
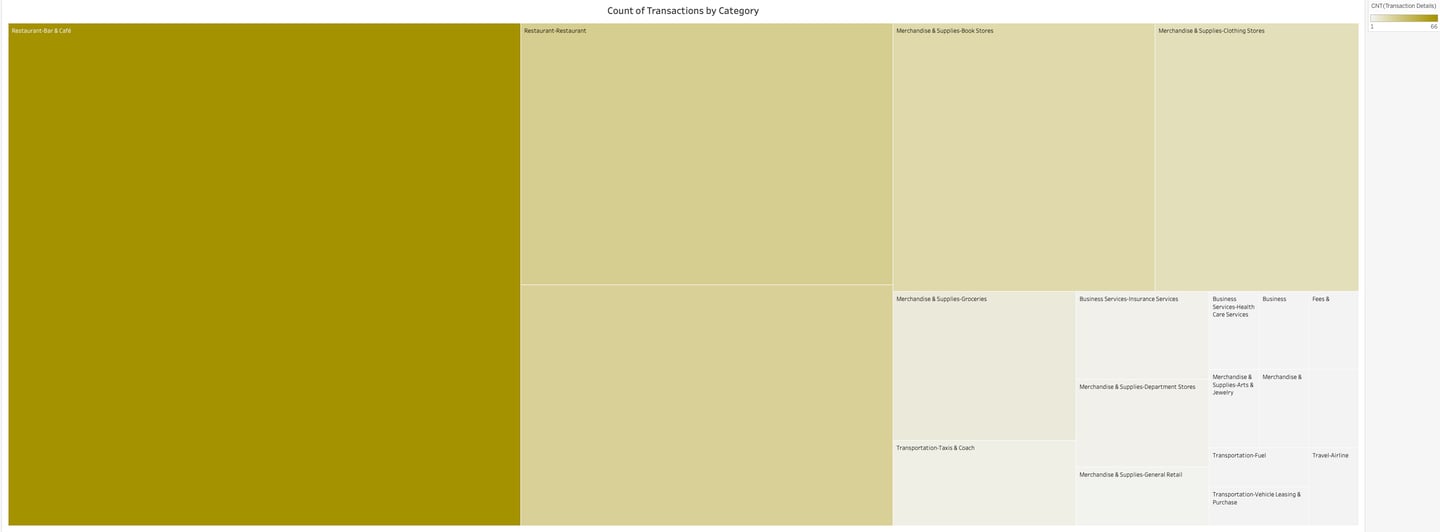
Last. let's look at count of transaction by category.
The chart above highlights the large representation of the Restaurant-Bar & Cafe category. For a more interactive experience, I invite you to refer to the Tableau Public dashboard at the end of this page. Hovering over the Restaurant-Bar & Cafe category reveals that it tops the list with 66 transactions, followed by Restaurant-Restaurant with 25 transactions. Interestingly, despite the Merchandise & Supplies - Clothing Stores category having a smaller count of 14 transactions, its expenditure volume, as shown in the first chart, is notably higher.
At this point, I have consolidated all the charts into a single comprehensive dashboard. In order to maintain a professional, cohesive, and visually appealing design, I opted to mirror the color scheme of the company and the credit card itself. Please click on the dashboard. This will redirect you to Tableau Public, where you can interact with the dashboard in a more dynamic and engaging way.