Data Pipeline Workflow
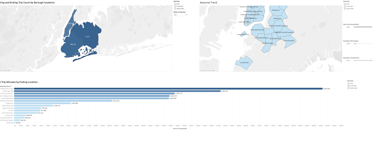
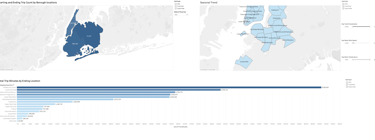
Station Demand Analysis: Cyclistic's Customer Patterns
In this fictitious workplace scenario, I assumed the role of a Business Intelligence Analyst at Cyclistic, tasked with analyzing customer behavior and patterns. To accomplish this, I employed a Data Pipeline Workflow that involved document gathering, the ETL process, and data visualization and analysis. Throughout the transformation process, I utilized MySQL for data transformation.
After gathering the necessary project information through three foundational documents in Step 1, I proceeded to Step 2. In this stage, I extracted data from diverse source systems, ensuring comprehensive coverage. I then performed the necessary transformations to enhance the quality and compatibility of the data, using the ETL process. Finally, I loaded the transformed data into the designated target system.
With the data transformed and loaded, Step 3 involved leveraging Tableau, a powerful data visualization tool. I utilized Tableau to create visually appealing and insightful representations of the data. Through data visualization and analysis, I was able to identify customer behavior trends, patterns, and correlations, providing valuable insights for decision-making and strategic planning.
(Please click on each step)
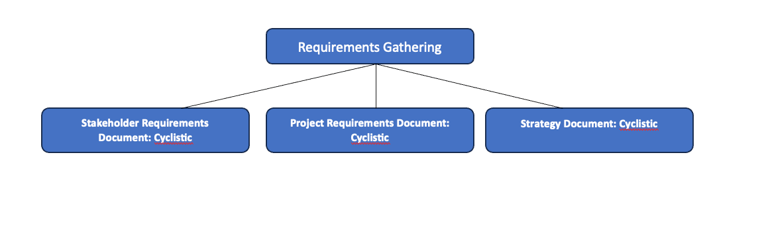
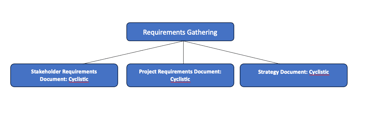
(Documentations & Requirements)
(Visualization & Analysis)